“Approximately 30% of organizations we study do pay for performance well,” consultant Jim Kochanski says, so it is possible, but it’s not automatic. “Fortunately, there are nine factors that can help the other 70%, he says.”
Most employers say they have pay for performance, says Kochanski, but they don’t. Unfortunately, employees spot that, and it sets them off, especially those who consider themselves to be top performers.
Why Pay for Performance?
- It is considered “fair” by most employees.
- It can motivate effort, focus, and cooperation.
- It can attract and retain “stars.”
- The alternative is not very good (the alternative is “entitlement”).
Kochanski, who is senior vice president of the performance and rewards practice at Sibson Consulting, says Sibson’s studies and work with clients has identified nine things that really make pay for performance real. There isn’t any one factor that will do it; you need all or at least most to create real pay for performance, he says.
1. Leadership Must Articulate Priorities for the Pay Program
Leadership needs to be aligned around what you’re trying to do with pay. What are the real priorities for your pay program? A typical list:
- Attract and retain most people
- Attract and retain key people/segments
- Motivate effort
- Align effort with goals
- Keep costs competitive
- Overall fairness/equity
- Cost of living
- No surprises—this year similar to last
In many cases Kochanski has seen, leaders are usually saying things related to the top four items, but the pay program is more about the bottom four items.
2. Your Pay Structure Defines Pay Opportunity
Most organizations have a pay structure (ranges, etc.) that should reflect internal and external equity. In the chart, the boxes represent internal rate ranges, and the dots represent external data.

The data for grades 3, 4, and 5 suggest that ranges need to be raised. If you are way off, as in this case, it’s tough to do pay for performance. Comp managers probably have a sense of what’s happening in this situation even without the chart—you get lots of requests for re-evaluation or lots of requests for raises that exceed guidelines.
———————————————————————————-
Master pay for performance at your organization—webinar coming next week. Learn more.
———————————————————————————-
3. Set and Align Goals
One Sibson study looked at more than 100 companies. “Best results” companies had a much higher rating of goal alignment.
CEO and Executive Team:
- Set company and executive goals.
- Review unit goals.
Business Units:
- Cascade corporate goals into mid-managers and business unit objectives.
- Align goals across functional units.
Individuals/Managers:
- Set employee goals and priorities linked to unit goals.
- Clarify expectations on “what to achieve” (results).
- Make goals and objectives visible to others.
It’s important to remember that you also have to cascade across so different departments’ goals are complementary and aligned with each other, Kochanski says. This is often the reason why pay for performance breaks down.
4. There Is a Norm of Differentiation
When trying to differentiate pay for performance, you have to set the norm. A chart like this can help management gauge whether it is working to the norms.
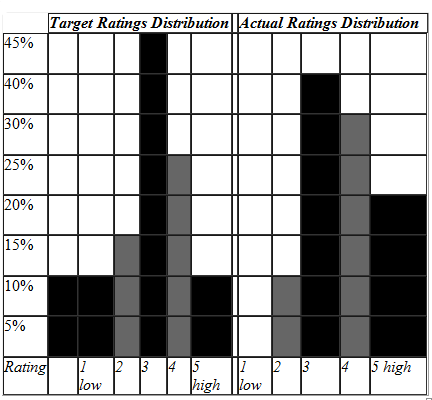
In the case illustrated in the charts, the actual distribution is skewed toward the higher ratings, suggesting that there isn’t as much differentiation as management desired.
5. Ensure Calibration Across Managers
Calibration across managers improves differentiation by reducing the subjectivity of ratings and encouraging similar standards across the organization.
Before ratings, rewards, and goals are finalized, peer managers compare recommendations with each other and their bosses. So peer managers can say, “That’s not how I would rate that person.” And you deal with the manager who says, “All my employees are top performers.”
One of the big barriers is that compensation planning schedules don’t leave time for calibration. The chart under # 6 is very helpful for calibration.
———————————————————————————————
Pay for performance: The new normal. Are you prepared?
———————————————————————————————
6. Use Metrics to Track Pay for Performance
This example compares different departments’ actual actions over the past year.
Compensation Scorecard
|
Department |
Average Performance Rating (1 – 5) |
Average Merit Increase (3% Budget) |
Promotion Rate |
Compa-Ratio |
Annual Incentive |
|
A |
3.4 |
3.0% |
3% |
101% |
100% |
|
B |
3.2 |
2.9% |
0% |
98% |
102% |
|
C |
4.0 |
2.9% |
12% |
96% |
105% |
|
D |
4.1 |
3.0% |
8% |
99% |
105% |
|
E |
4.3 |
3.5% |
17% |
105% |
115% |
|
F |
3.1 |
3.2% |
20% |
104% |
95% |
|
G |
3.2 |
3.0% |
5% |
99% |
100% |
|
H |
4.2 |
3.2% |
20% |
97% |
110% |
It’s clear that the other departments are going to grill Department E about how it is above the norm. This chart is great for promoting visibility and accountability. Clients that have used this have improved their execution of pay for performance.
In tomorrow’s CED, factors 7 through 9.